01
Battery sizing
1–2 concrete battery recommendations with power (kW) and capacity (kWh)
We size the battery based on your actual load profile, not rules of thumb.
We size your battery so that the calculated economics hold up in practice. You receive:
1–2 concrete battery recommendations with power (kW) and capacity (kWh)
Expected payback period, annual savings potential, investment range
Side-by-side assessment of the main operating strategies and their savings impact
How robust the results are when electricity prices, load profiles or contracts change
No two industrial sites are alike. Grid connection, voltage level, load curve, power contracts and on-site generation determine the economics. Blanket rules fall short.
Electricity costs barely fall. Capacity charges, grid fees and self-consumption stay almost unchanged, and the business case collapses.
Unnecessary investment with no added benefit. Excess capacity ties up capital without delivering further savings. In operation, the extra capacity is systematically underused.
First understand the load profile. Then size the battery.
We analyse your site in three clear, traceable steps, from the underlying data to the battery recommendation.
We import load profiles and tariff data, check them for completeness and plausibility, and clean up metering errors and outliers.
Our software systematically simulates different battery sizes and operating strategies: peak shaving, solar self-consumption and more. The goal is not the theoretical optimum but the most cost-effective solution.
For each option we calculate investment and operating costs, annual savings, the expected payback period and how sensitive the results are to changes in electricity prices or usage profiles. From these options we identify the solution that fits your strategy.
For reliable sizing, our software systematically combines four site-specific data sources.
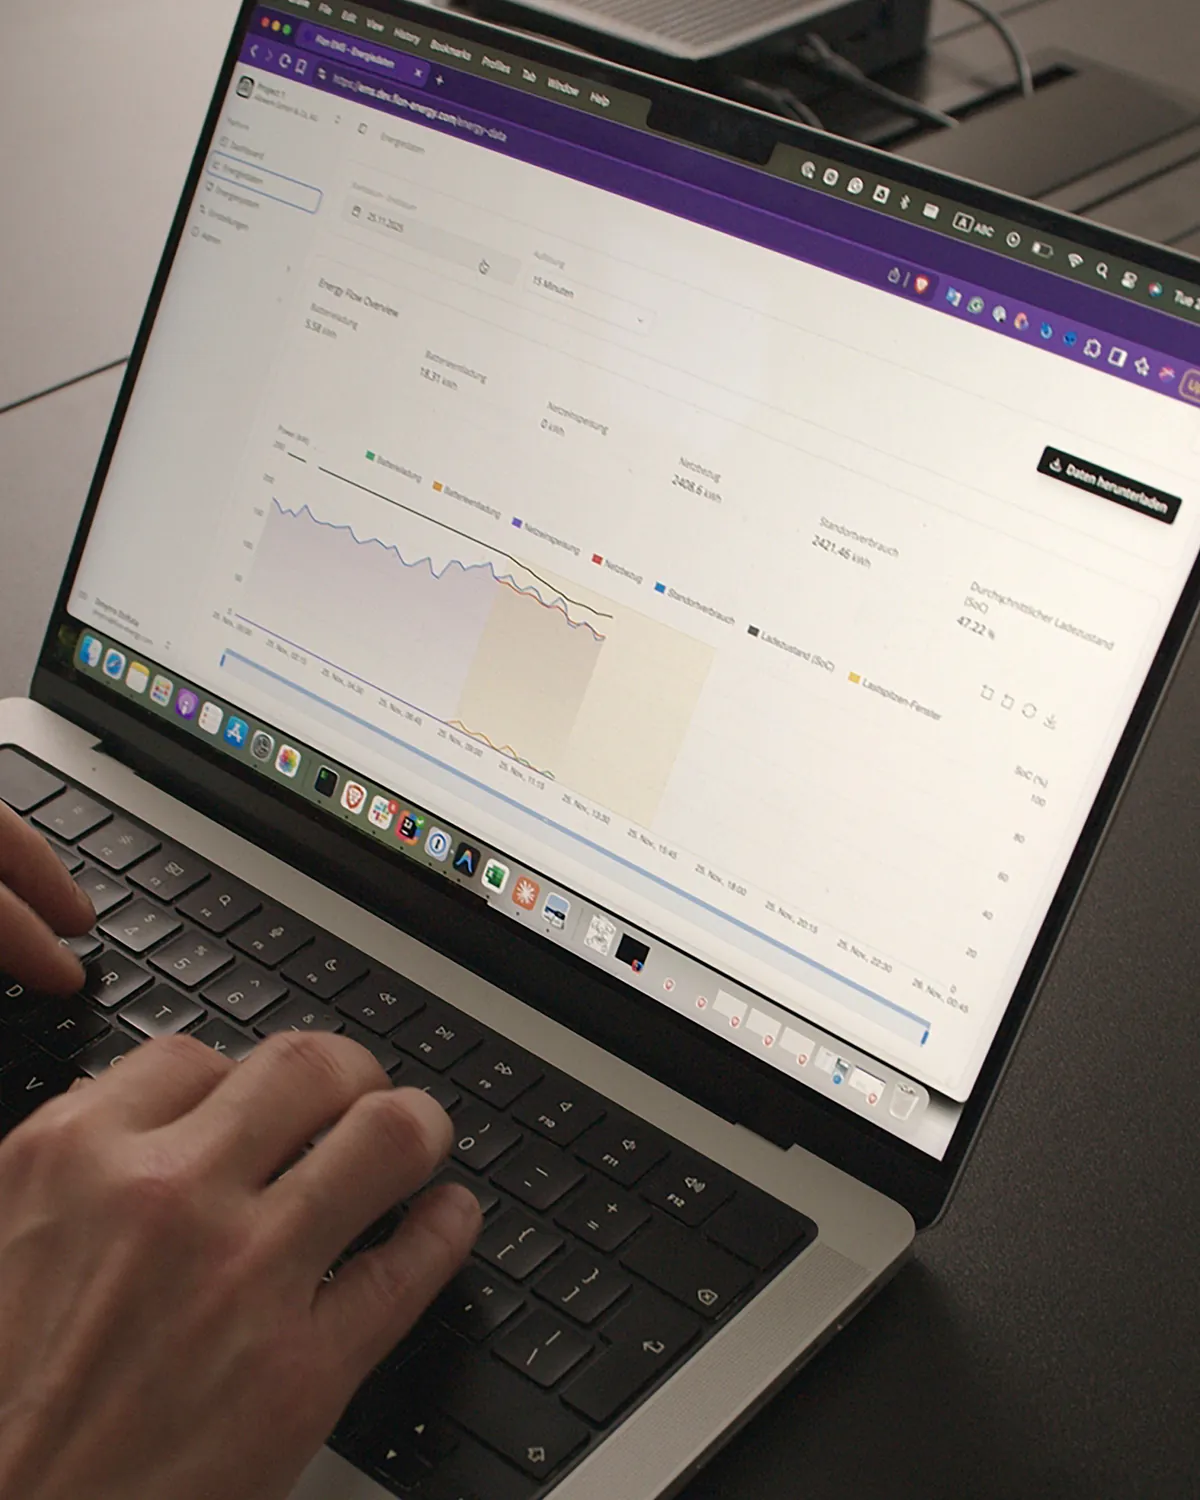
We assess it using your operating and consumption data.